How DFA Adds Value to Their Bond Funds
At Clarity Capital Advisors, one of the bond funds we utilize for our clients is the DFA Investment Grade Portfolio (DFAPX) which functions as a core bond holding, having exposure to short-term, intermediate-term, government, corporate, and some international as well. The reason we prefer this fund to a total bond market index fund is that we are convinced that DFA’s management approach adds value beyond simply having low costs.
As with its equity funds, DFA is not required to adhere to a published index, which gives them greater flexibility in trading bonds. Based on an internal study using data from the Trade Reporting and Compliance Engine, DFA’s patient and opportunistic approach to trading has yielded a price advantage compared to other market participants.
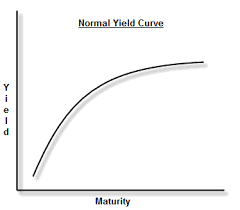
Another way that DFA adds value is through its variable maturity and variable credit strategies. This will take some explaining, so let’s start with variable maturity. Recall that the Treasury yield curve shows us the relationship between maturity length and yield to maturity for Treasury bonds. In normal times, it is a direct relationship, as lenders who commit funds for a longer period of time expect to be compensated with a higher return. The yield curve as of 3/27/2017 for Treasuries ranging from 5 to 10 years is shown below:
Maturity (Years) Yield-to-Maturity
5 1.93%
6 2.07%
7 2.20%
8 2.26%
9 2.32%
10 2.38%
Source: https://www.treasury.gov/resource-center/data-chart-center/interest-rates/Pages/TextView.aspx?data=yield, interpolation used to obtain values for 6, 8, and 9 years.
One important aspect of an increasing yield curve is that there is an additional pick-up in return as a bond ages, or as it moves from a higher-yielding maturity to a lower-yielding maturity. For the numbers above, we can estimate the one-year return (assuming all are zero coupon bonds) as follows:
Maturity (Years) Expected Return in the First Holding Year
6 2.77%
7 2.98%
8 2.68%
9 2.80%
10 2.92%
As you can see, there is a sweet spot at the 7-year bond in that it has the highest expected return for the next year. Also, the fact that we would expect it to have a lower volatility than any of the higher maturities makes it even more attractive. An important underlying assumption of the variable maturity strategy is that the best predictor of tomorrow’s yield curve is today’s yield curve. Regarding that, we have yet to see anyone who can reliably forecast future yield curves.
The variable credit strategy utilizes a similar approach based on the spreads between government and corporate bonds of different quality ratings. While higher spreads are indicative of higher expected returns resulting from higher credit risk, it is important to remember that the spreads themselves do not tell us the additional expected return because some of the spread will likely be lost to downgrades and defaults. Diversification is essential to mitigate default risk. To summarize, when spreads are high relative to historical averages, it may be beneficial to increase the exposure to corporate bonds, perhaps targeting a particular credit rating where the spread is substantially higher than the more highly rated bonds. Likewise, when spreads are low, increasing government bonds would be advisable. In other words, we want to take risk when risk premiums are high, and spreads give us an excellent proxy for the credit risk premium.
To conclude, we currently utilize the DFA Investment Grade Portfolio (DFAPX) because it retains the low-cost structure of a passively managed total bond market fund yet offers opportunities for enhanced returns through a flexible trading approach and variable maturity/credit portfolio construction strategies. As of now, we have five calendar years of returns (2012-2016) with DFAPX coming in at 2.52% compared to 2.23% for the Bloomberg Barclays U.S. Aggregate Bond Index. In fairness, DFAPX did have a higher volatility, but we would consider it well within an acceptable range for a long-term investor with a balanced portfolio.

